I stopped opening a chart first
I stopped opening a chart first. But that was never the plan.
What I actually set out to do was automate as much of my trading morning as I could. The chart thing — looking at a dashboard before I look at price — was a side effect I didn't see coming. So was the way the tool started making decisions with me. Both came out of one simple goal: take the repetitive parts of my pre-market process and let software do them.
This is the story of how that automation drive turned into the thing I now open before anything else.
It started with the repetitive parts
The original problem wasn't sophisticated. It was effort I was repeating every single morning.
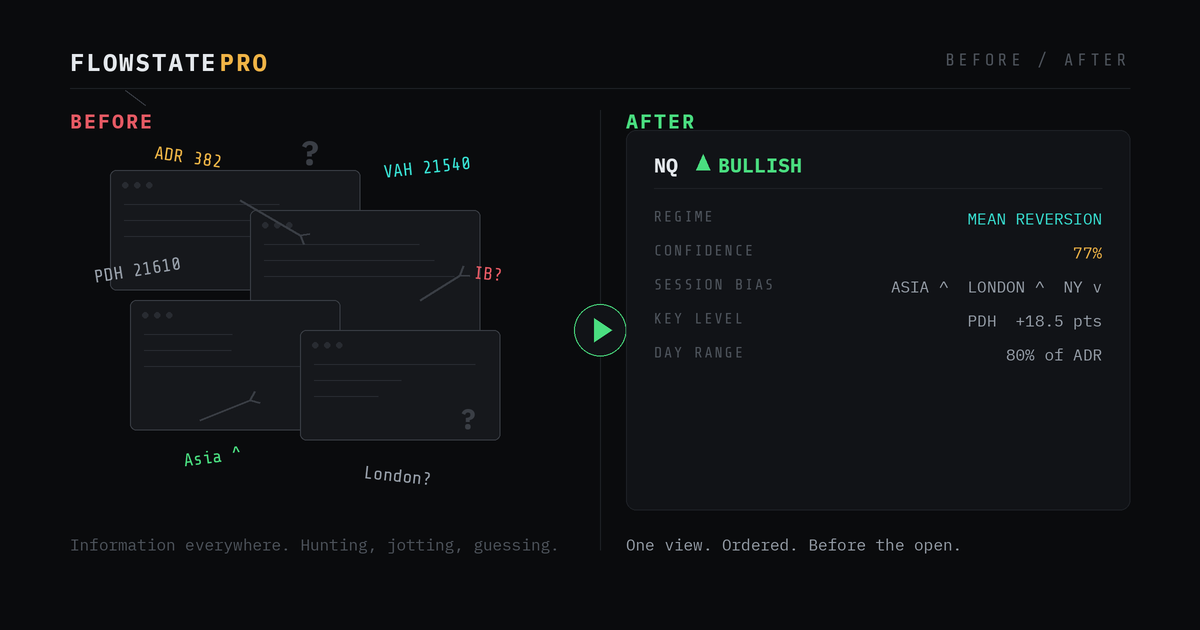
Before a session I needed a handful of things to get oriented. Where were the key levels — previous day high and low, value area, the overnight range? What was the average daily range, and how much of it had already been used? What had Asia done, and London after it? Was the initial balance formed yet?
None of this was hard to work out. But I was doing it by hand, every day — checking one thing here, calculating another there, pulling a third from somewhere else. The same manual routine before every open. It was exactly the kind of repetitive, rules-based work that software should be doing, not me.
So I automated it. One view that computed and surfaced all of it together — regime, session bias, key levels, range context — for NQ, ES, and DAX, before the open. The goal was simple: stop spending my attention gathering the picture so I could spend it thinking about it.
That alone was worth it. But it's not where it stopped.
Then it became the thing I look at first
Once the data was all in one place, something shifted. I noticed I'd stopped reaching for the chart first. I'd open the dashboard, get the read — what kind of market is this, which way is it leaning, where are the levels that matter, how much range is left — and then go to the chart, already knowing what to expect.
That sounds like a small reordering. It isn't. Opening a chart first means you start with price and work backwards to meaning — and price is seductive. A green candle pulls you long before you've asked whether it's a trend day or a chop day. Starting with the dashboard means you arrive at the chart with context already loaded. You're no longer reacting to price; you're checking price against a read you formed before it could bias you.
Context before the chart. I'd written that line as a tagline. Then I realised I'd started living it.
And then it started doing things I didn't design
The part I didn't expect was that the dashboard began making decisions with me, not just informing them.
The clearest example is what I came to call the proximity gate. Originally, distance-from-level was just information — a number telling me how far price sat from the nearest key level. I'd glance at it and move on.
Then I noticed a pattern in my own losing trades: a lot of them happened when price was stranded in no-man's-land, far from any level. No structure nearby meant no clean place for price to react — and without a reaction point, I was essentially guessing. The good trades clustered when price was near a level, where there was something real to trade against.
So the distance number stopped being information and became a filter. When price is too far from any key level, the gate fires — and that's my signal to stand aside, not force a setup into an environment that doesn't have the structure to support it. Some of the best trading decisions I make now are the trades I don't take, flagged by a number I originally added just to look at.
That's the thing about building your own tools: if you build them around how you actually think, they start to think alongside you.
Why I'm telling you this
FlowState Pro didn't start as a product. It started as me trying to automate my own morning — to take the repetitive prep off my plate so I could spend my attention on decisions instead of data-gathering. The chart-first habit and the proximity gate weren't designed; they emerged. And the fact that I use this every single day, in ways I never planned, is the reason I think it's worth putting in front of other traders.
The chart tells you what's happening. The dashboard tells you what it means. I look at meaning first now — and I'm not going back.
That's where the edge starts. Before the open. Before the chart.